PREDetector software
Version 4 - February 2026
License GNU GPL-3


Genome selection
Matrix selection
Functional analysis
Submit job
Contact us if you have questions or want to report a bug
PREDetector R package
The source code for the PREDetector R package is available at https://gitlab.uliege.be/ptocquin/RPREDetector.git under the GPL-3 license.
Publications
If you have found the PREDetector web service useful, please cite:
- For the concept and scoring of the tool:
- For the webtool and R package:
-
PREDetector: A new tool to identify regulatory elements in bacterial genomes
Hiard Samuel, Marée Raphaël, Colson Séverine, Hoskisson Paul A, Titgemeyer Fritz, Van Wezel Gilles P, Joris Bernard, Wehenkel Louis, Rigali Sébastien
Biochemical and Biophysical Research Communications (2007) doi: 10.1016/j.bbrc.2007.03.180
-
PREDetector 4.0: Associating metabolic pathways to bacterial regulon prediction
Ribeiro Monteiro Silvia, Tocquin Pierre, Anderssen Sinaeda, Rigali Sébastien
Manuscript in preparation (2026)
PREDetector Help page
Welcome to the documentation of the PREDetector v.4 (Prokaryotic Regulatory Elements Detector), an updated web-based platform for position weight matrix (PWM)-driven prediction of transcription factor (TF) regulons in bacterial genomes.
The help page contains the following sections:
WARNING:
We recommend using Chrome, Edge or Firefox for this website. Certain functionalities may not work properly on Safari.
PREDetector Workflow
PREDetector v4.0 provides a user-oriented webserver for predicting transcription factor regulons in bacterial genomes, with functional analysis of associated metabolic pathways and biological processes.
The workflow consists of four main steps:
Step 1:
Selection of a bacterial genome, either from the integrated KEGG collection of over 9,000 genomes or by uploading user’s bacterial genome.
Step 2:
Selection of a transcription factor PWM, either from one of four available databases (RegPrecise, LogoMotif, Prodoric, or COMMBAT DB) or by providing an user-defined PWM in FASTA format.
Step 3:
PREDetector performs regulon prediction, displaying predicted TF binding sites in an interactive genomic mapping viewer and corresponding results table.
Step 4:
PREDetector performs functional analysis by associating predicted target genes to metabolic pathways and biological processes, with results presented in an interactive barplot and table.
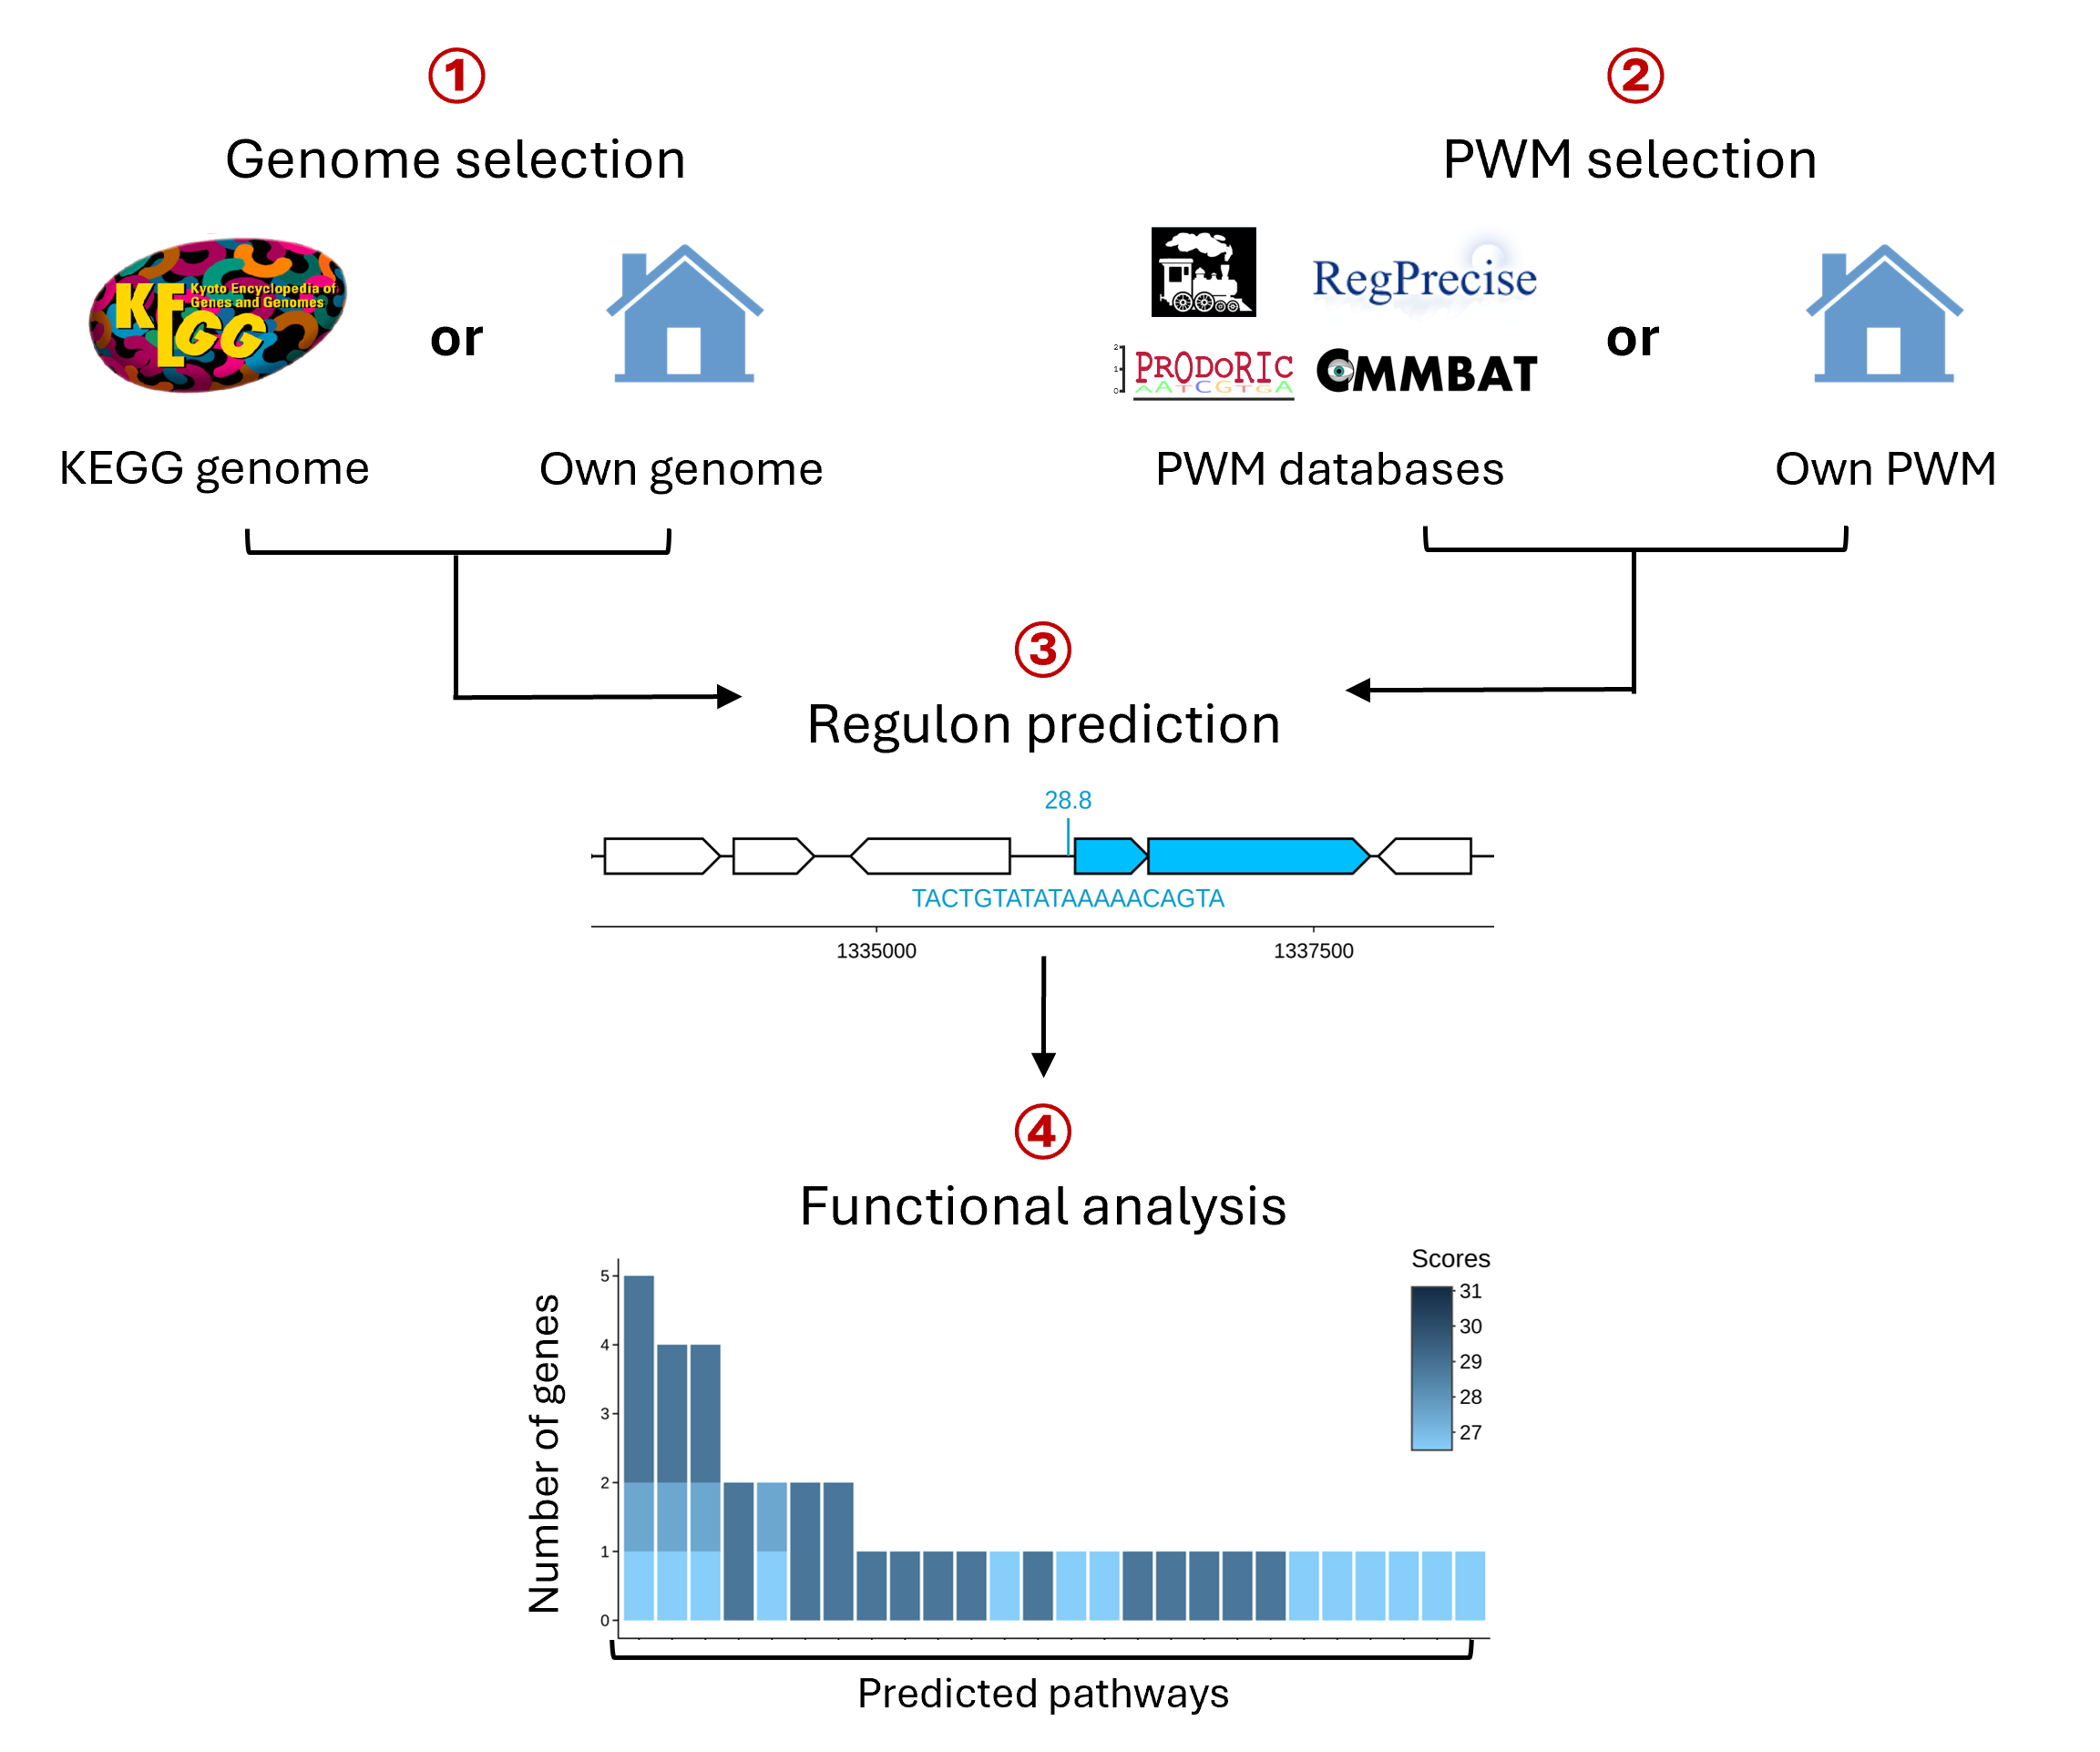
Workflow PREDetector v4.0. The PREDetector workflow consists of four main steps: (1) Genome selection; users either select a genome from over 9,000 KEGG bacterial genomes or upload their own bacterial genome files. (2) PWM selection; users either select a PWM from one of the four different databases or upload their TFBS sequence in FASTA format to generate their own PWM. (3) Regulon prediction; results are shown in an interactive mapping viewer and table, showing the genomic location of predicted sites relative to genes and the associated predicted co-transcribed genes. (4) Functional analysis; predicted target genes are analyzed for associated metabolic pathways and biological processes with results visualized in an interactive barplot and table.
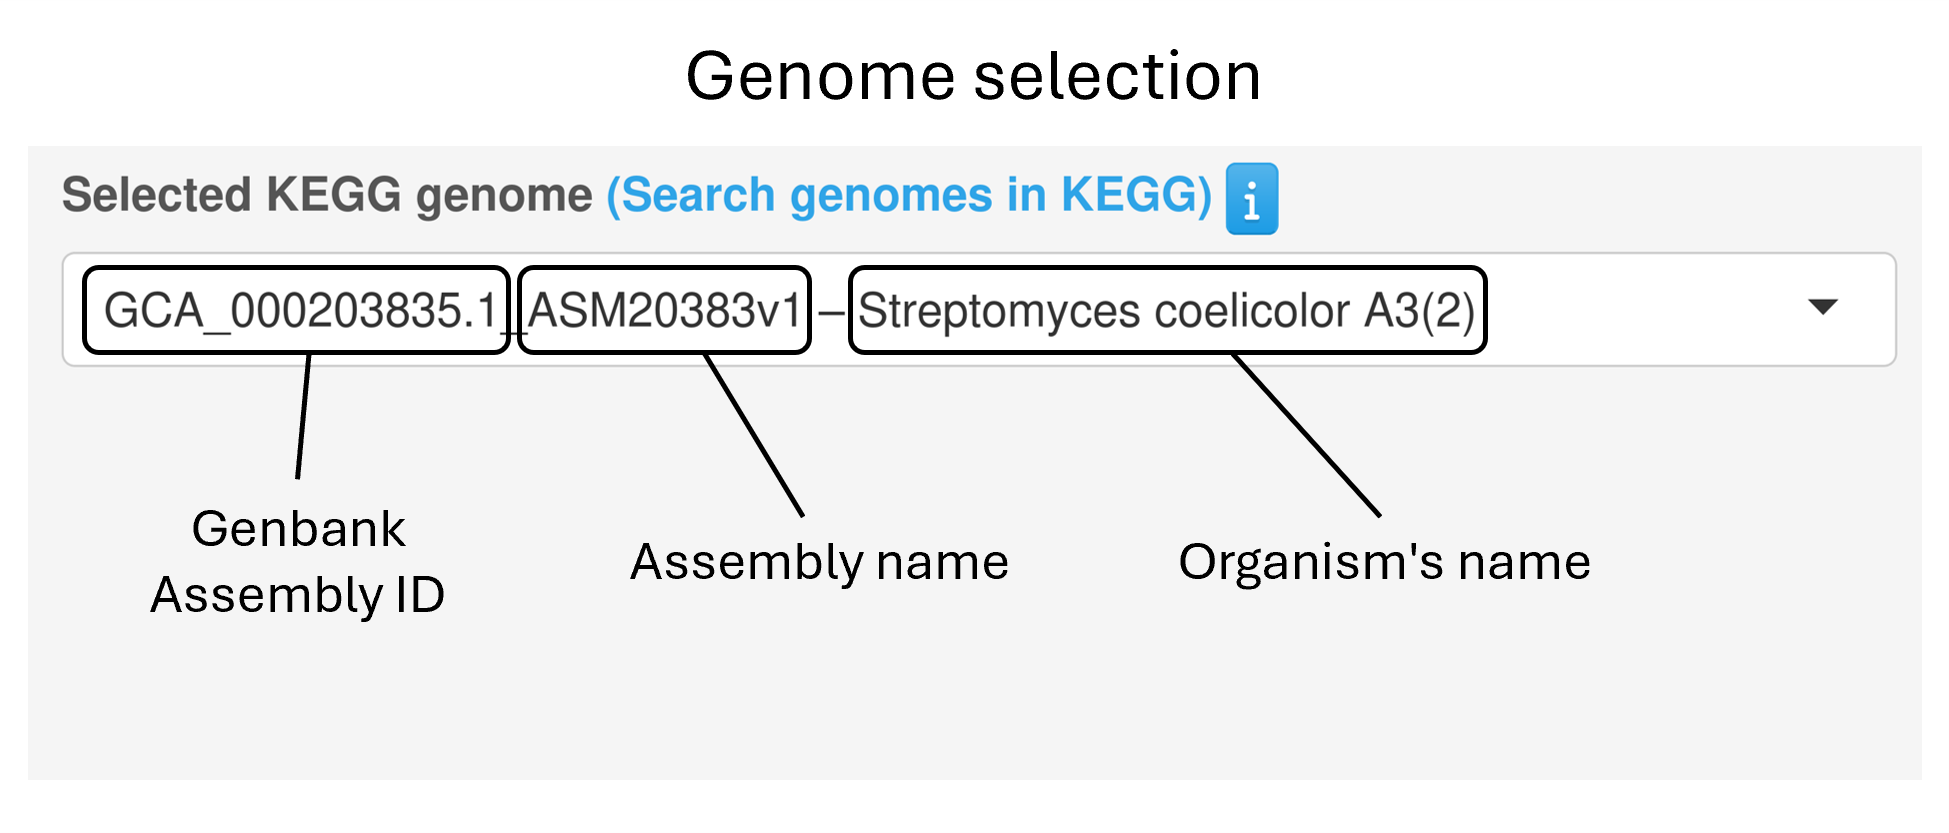
Genome selection
Users can choose a bacterial genome from the integrated KEGG collection, which can be queried by:
-
Organism’s name
-
Genome’s assembly name
-
Genbank/RefSeq assembly ID
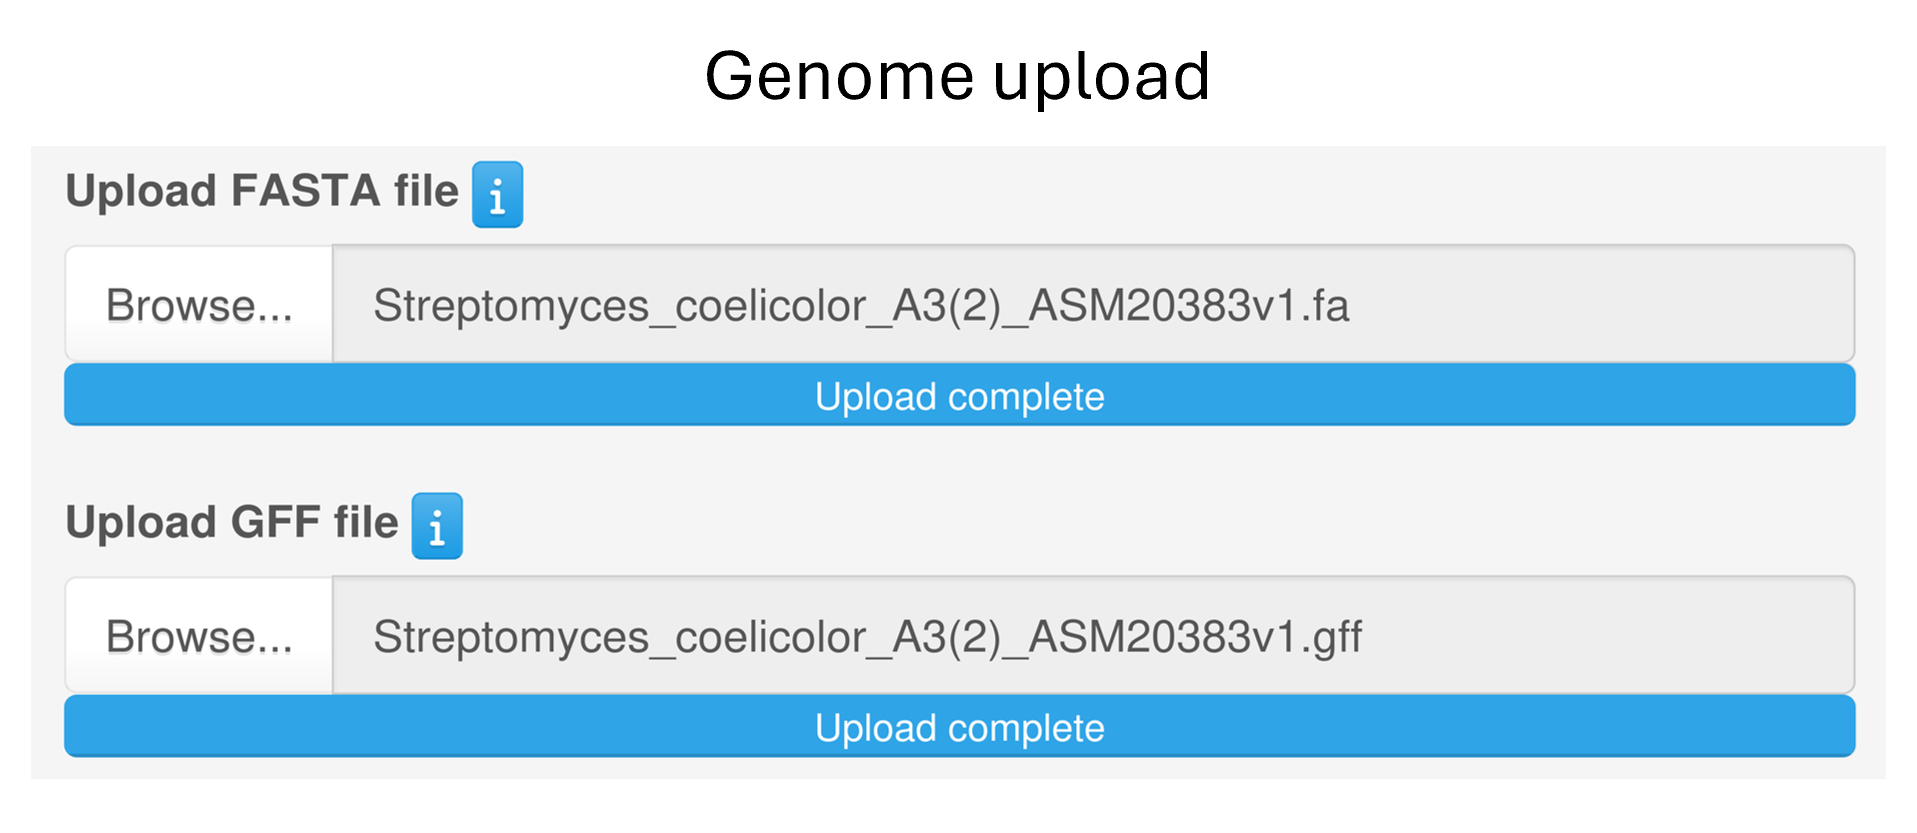
Alternatively, users can upload their genome of interest by providing the nucleotide sequence together with the corresponding annotation file (in FASTA and GFF3 format, respectively).
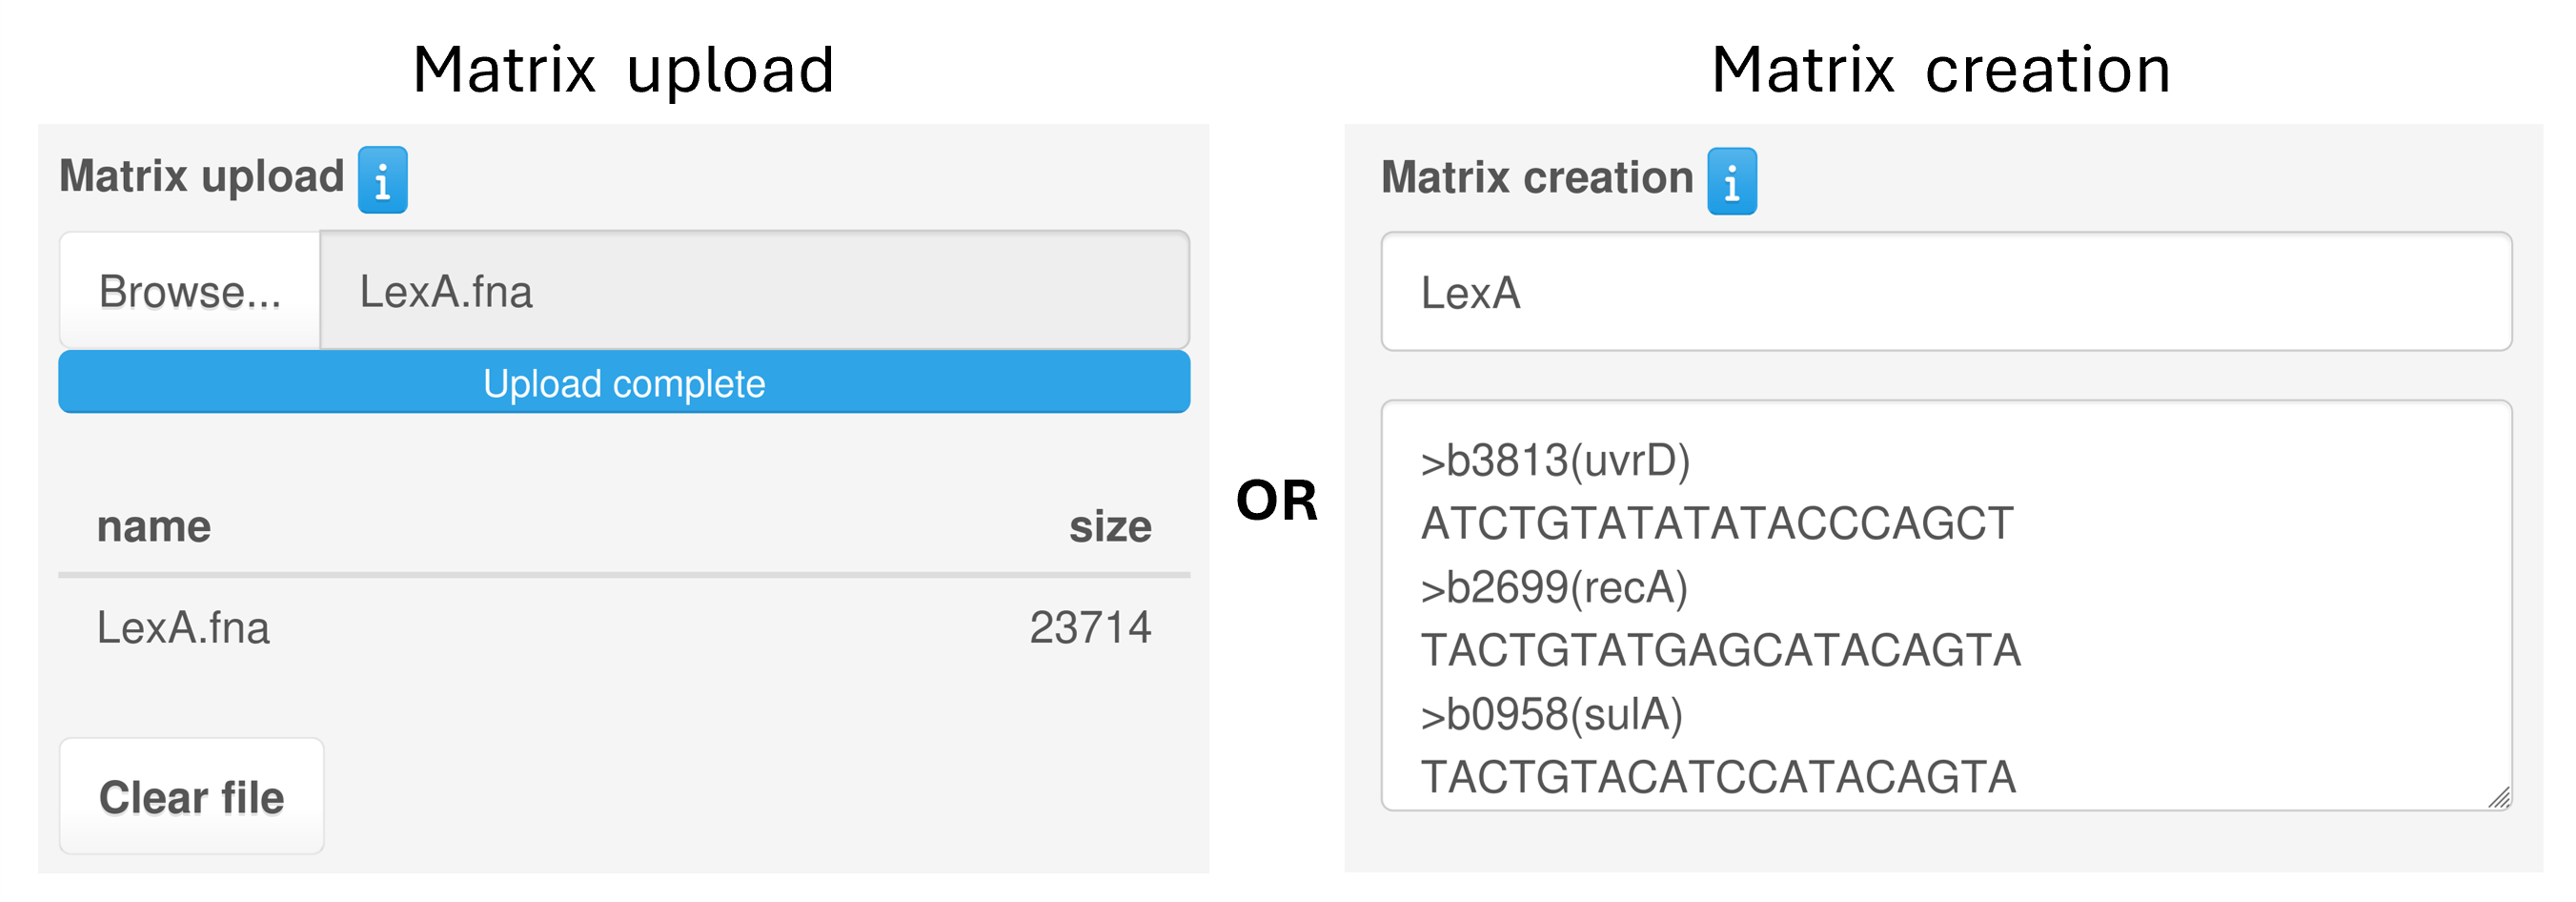
Matrix selection
Users can choose a position weight matrix (PWM) for a transcription factor of interest from one of four databases: COMMBAT DB, RegPrecise, Prodoric, or Logomotif. These PWMs can be queried by:
-
TF name
-
TF family
-
Bacterial family
-
Database source
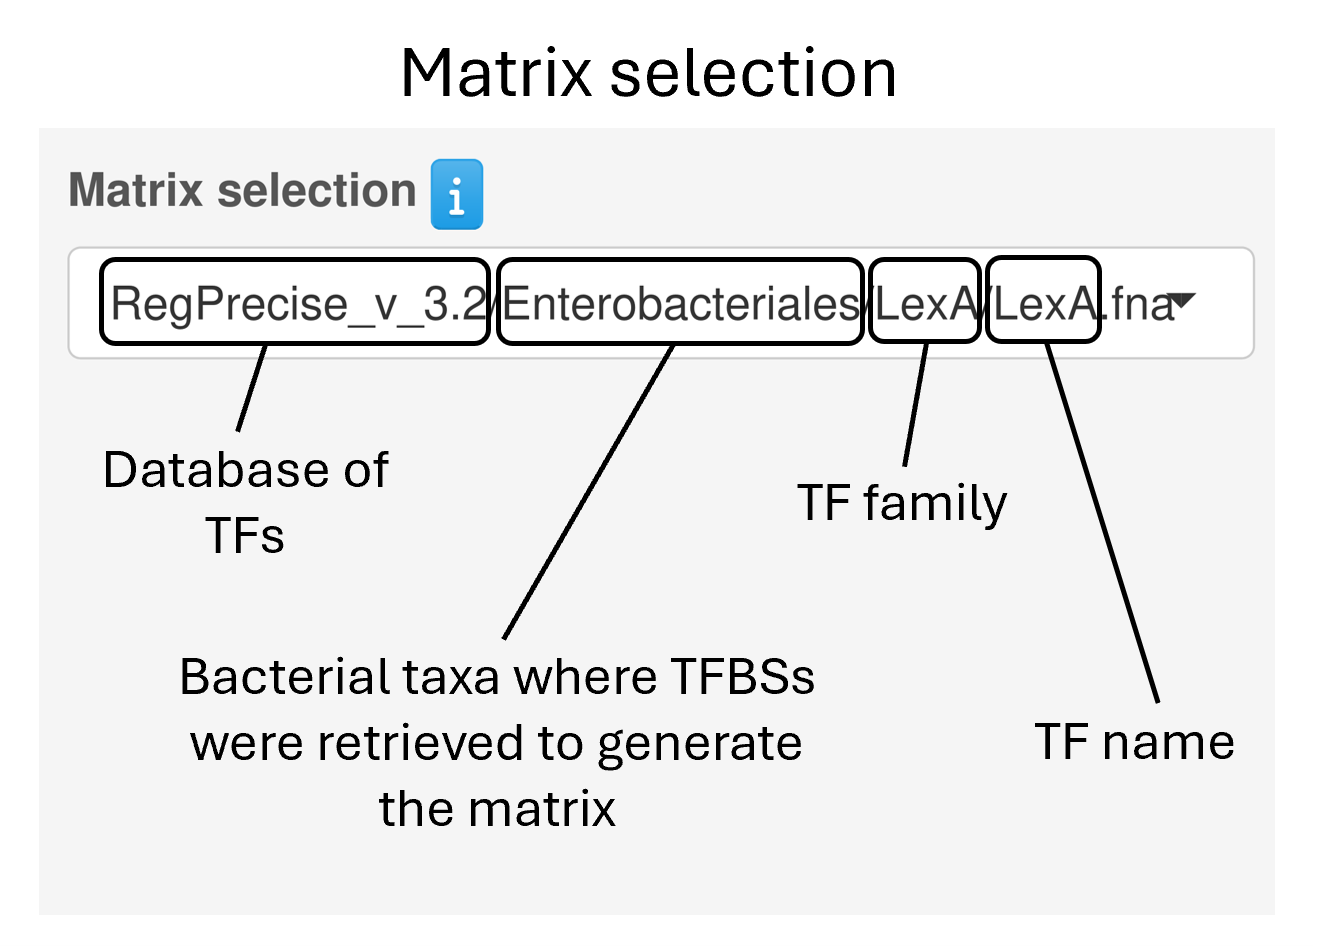
Alternatively, users can also create a custom PWM by providing sequences bound by your transcription factor in FASTA format, either by typing them in or by uploading a FASTA file.
Regulon prediction
Overview
The regulon prediction tab is structured into four sections: a Customization Panel (A), a Prediction Reliability Curve (B), an Interactive TFBS Mapping Viewer (C), and an Interactive Result Table (D). Together, these modules allow users to dynamically explore, filter, and interpret predicted TFBSs and target genes.
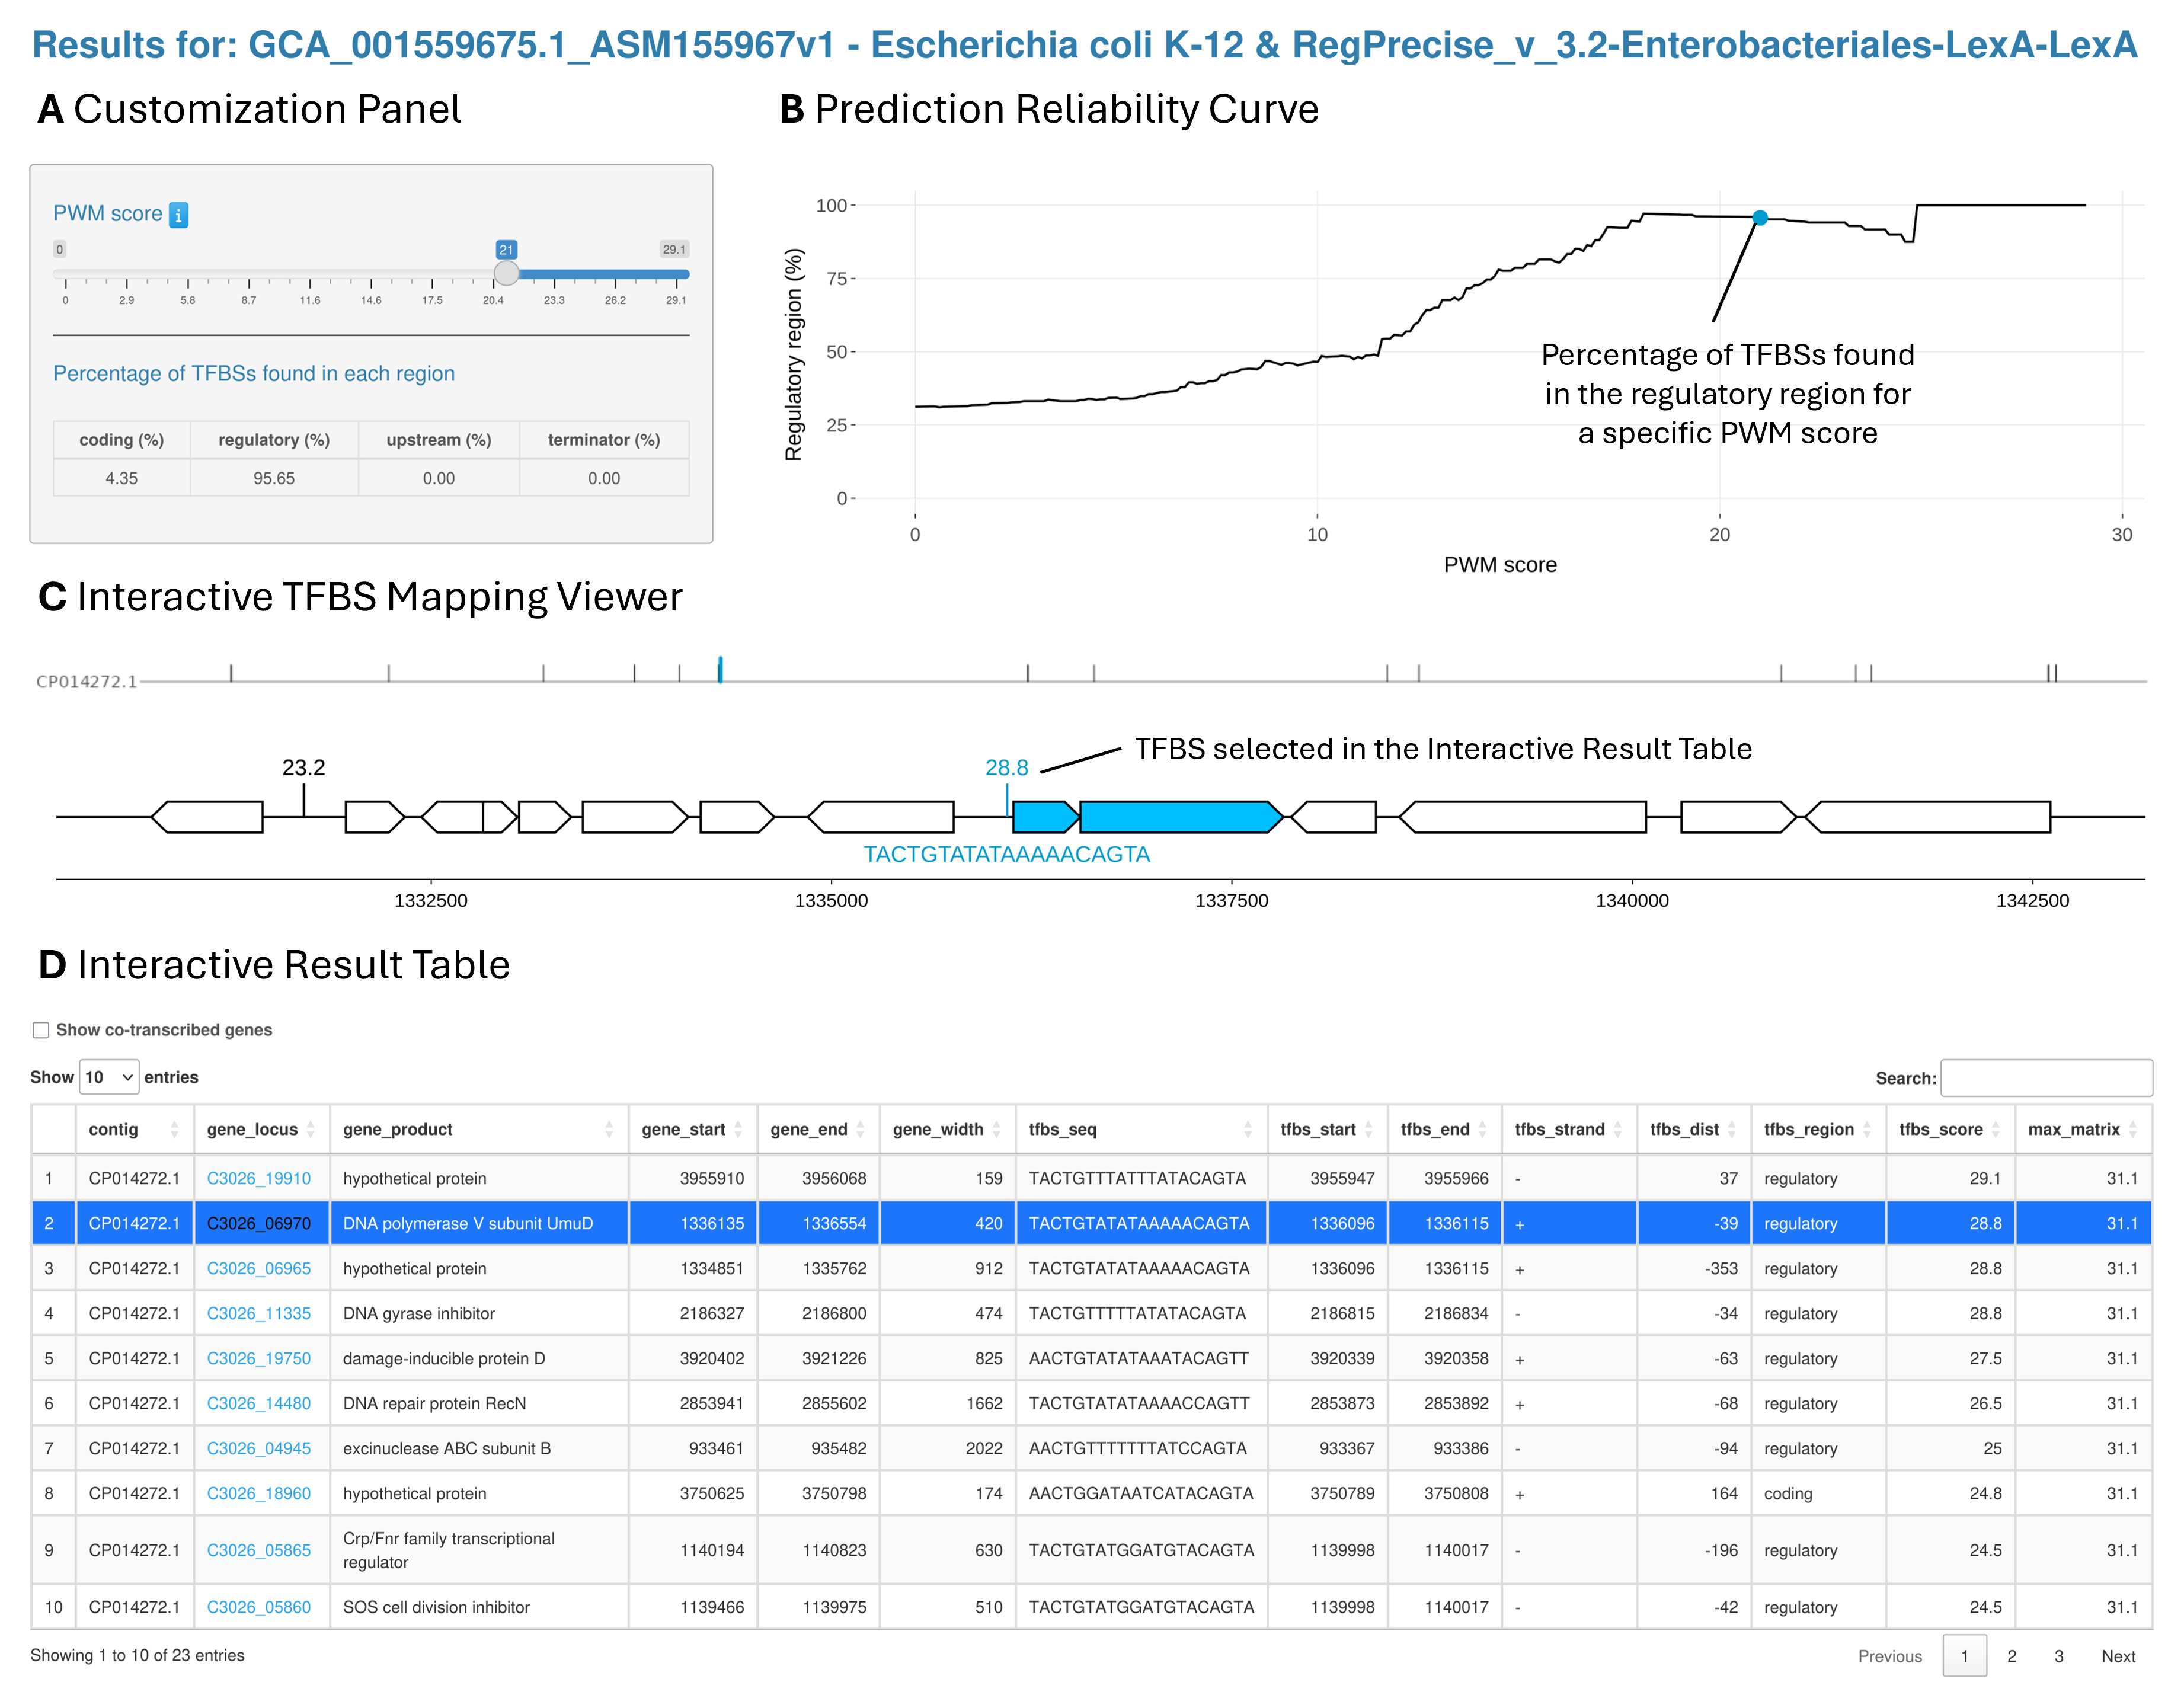
Overview of the regulon prediction result page. A. Customization Panel. It contains a slider to adjust the PWM score threshold, which is immediately updated in the Region Percentage Plot and Results Table. The percentages of TFBSs found in each region (coding, regulatory, upstream, and terminator) are also displayed and updated according to the selected PWM score threshold. B. Prediction reliability curve. A plot representing the percentage of TFBSs found in the regulatory region (-400 to +100 nt) depending on the TFBS score. C. Interactive TFBS Mapping Viewer. An interactive representation of the genetic organization around the selected TFBS from the Interactive Result Table. D. Interactive Result Table. The table lists all the predicted TFBS above the selected score threshold. Users can sort the table by any column and type in key words to look for specific results. There are also hyperlinks in the table connecting predicted target genes to their KEGG gene page.
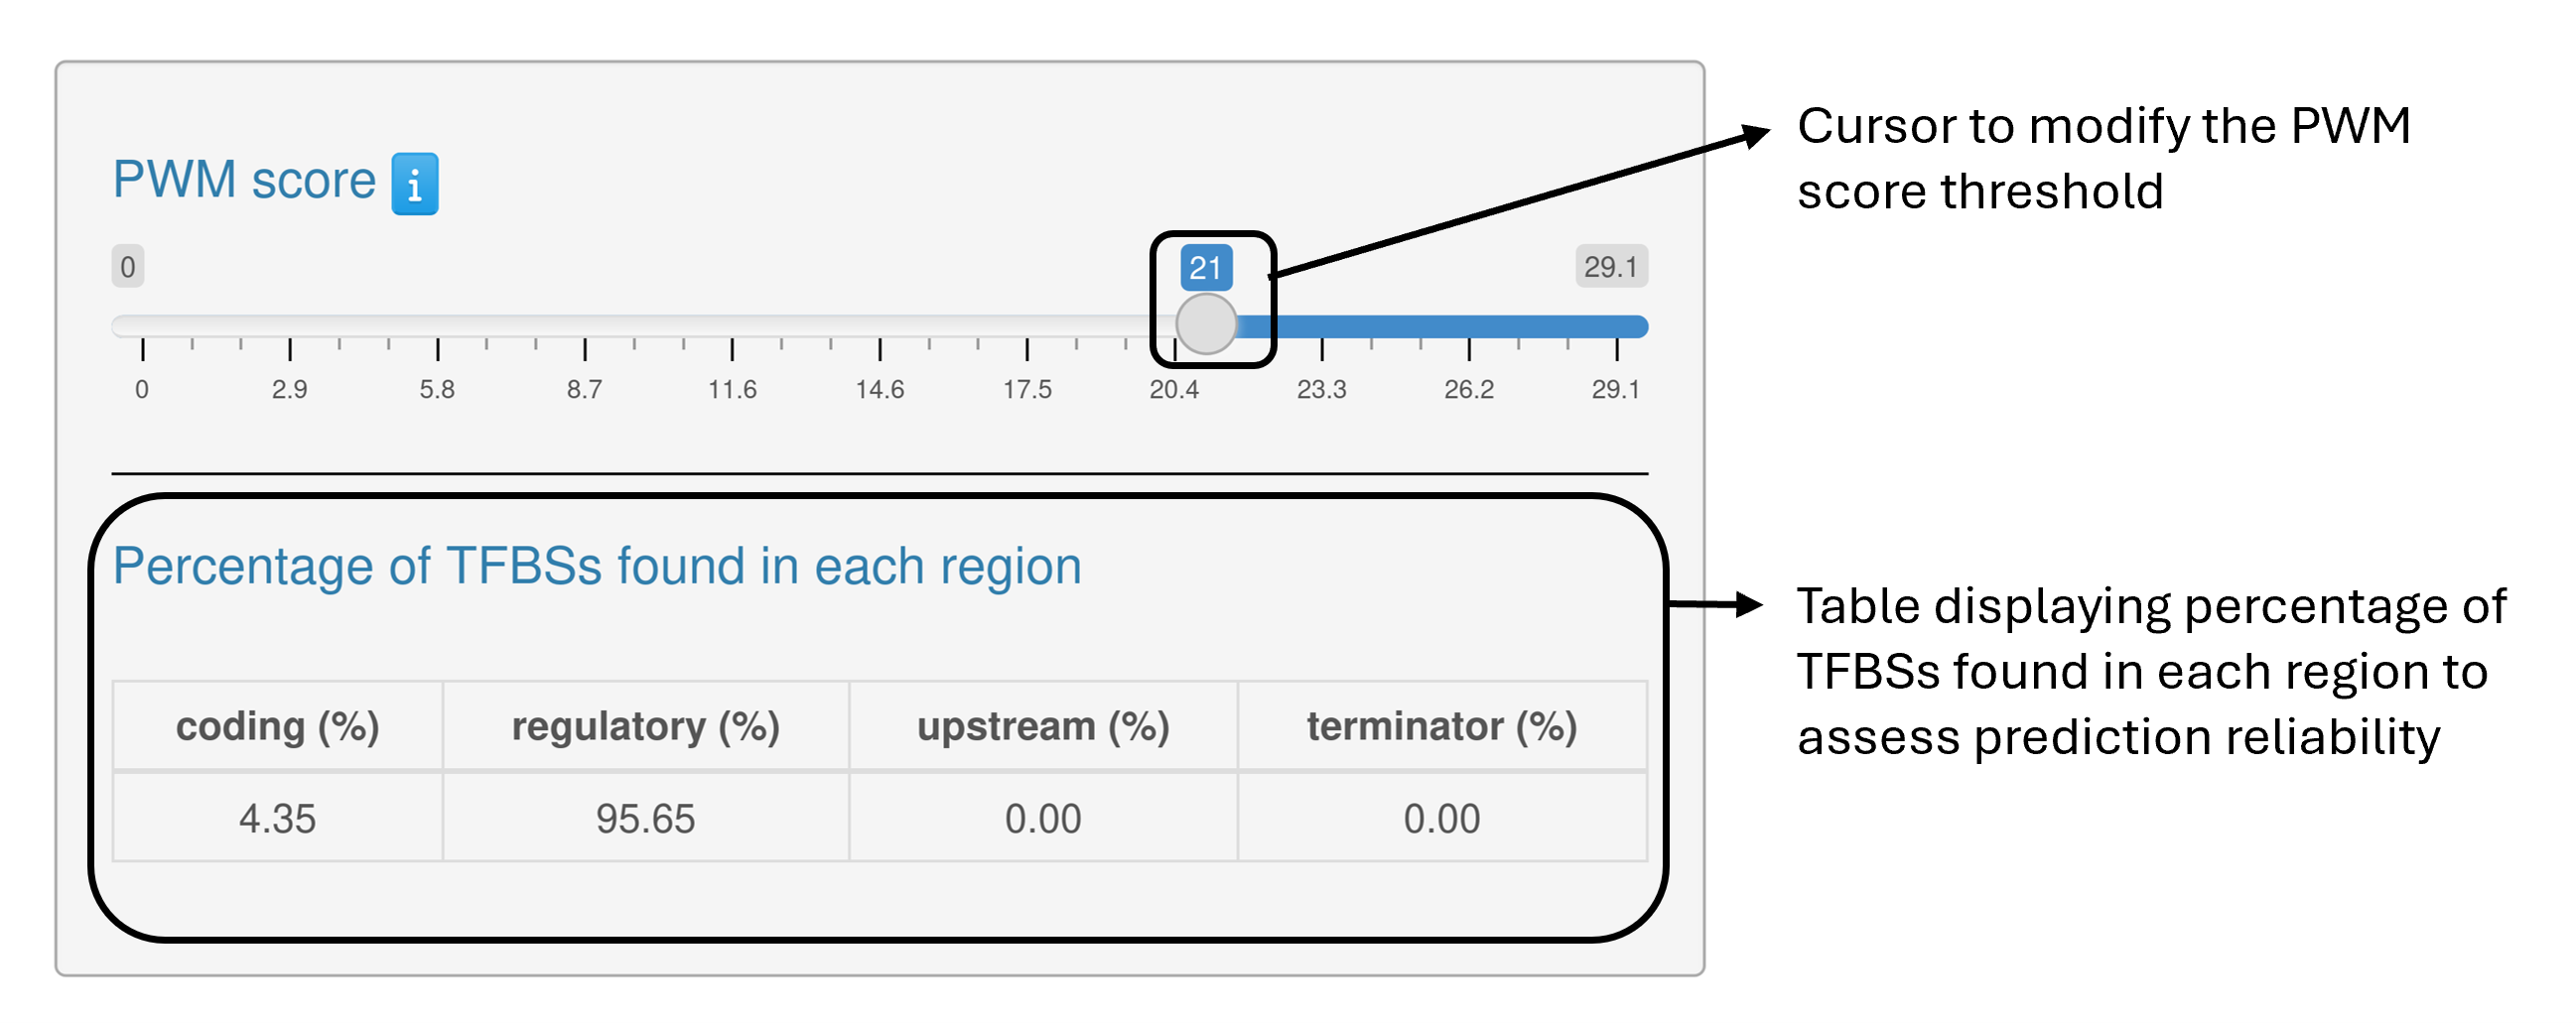
Customization panel
PREDetector enables users to adjust a set of parameters and options that directly affect both the mapping viewer and the results table.
The regions and co-transcribed genes are defined as follows:
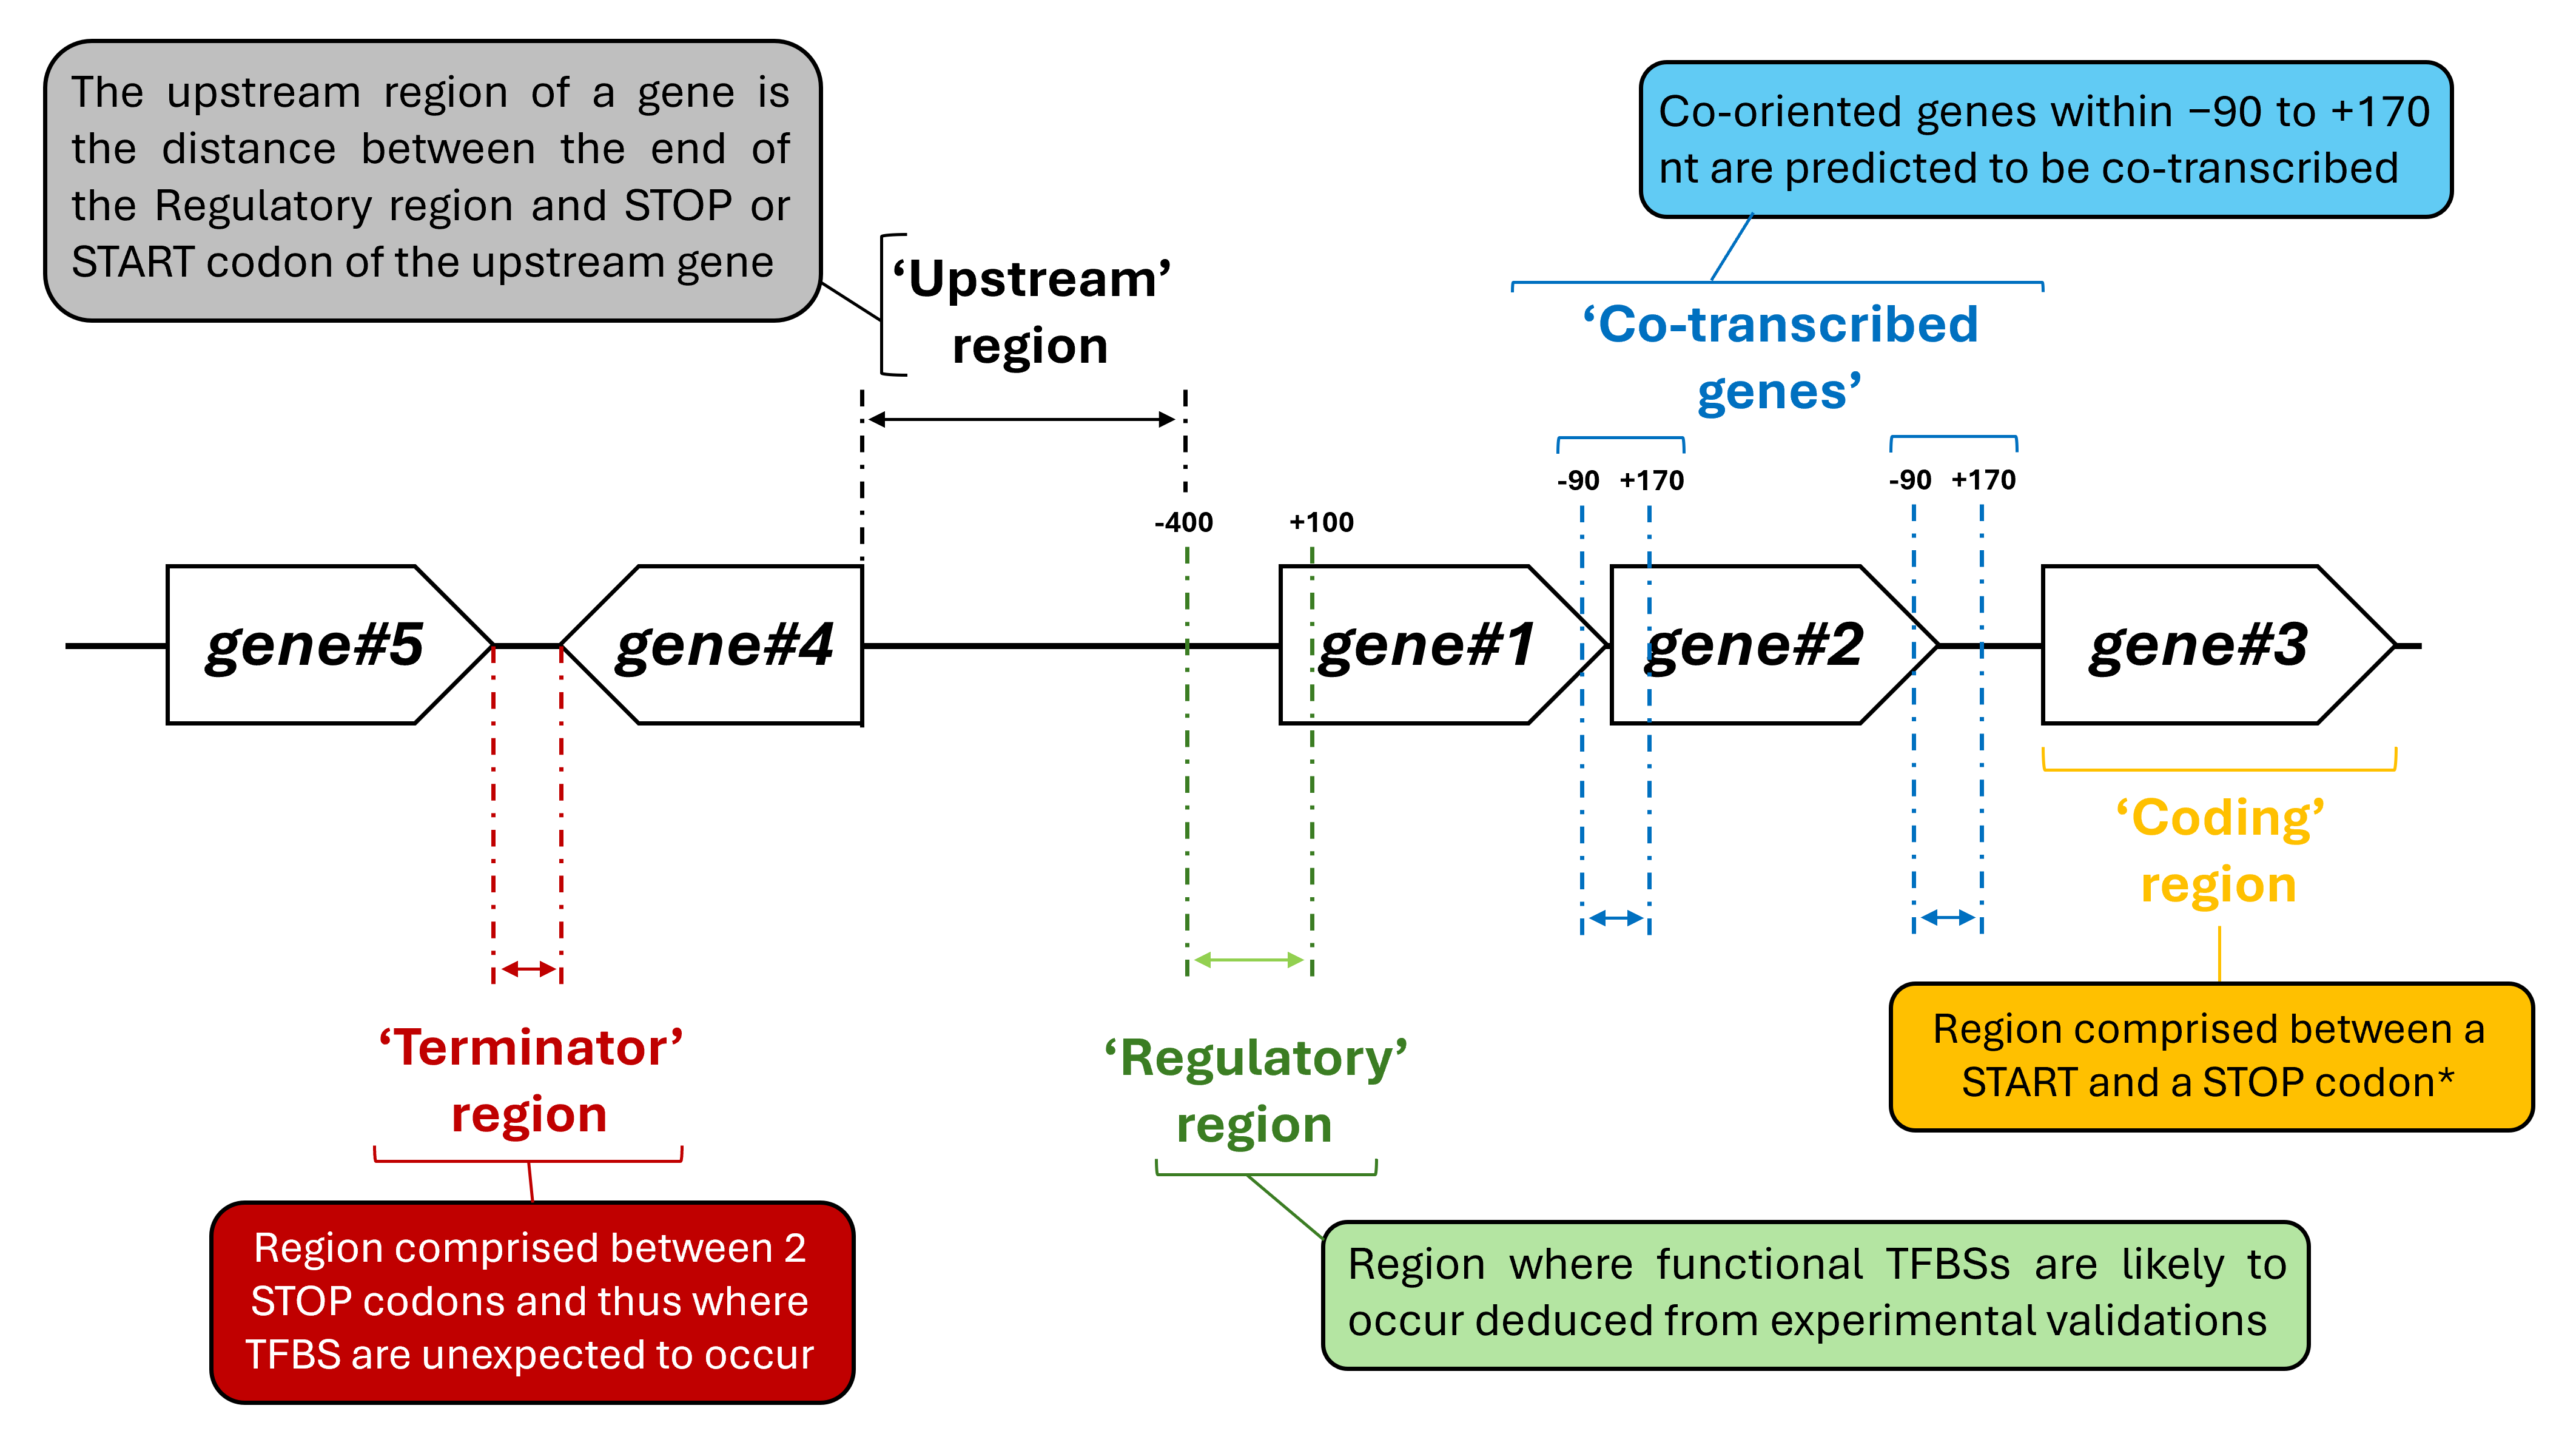
* If a TFBS overlaps both coding and regulatory regions, it is classified as part of the regulatory region.
Interactive result table
A searchable and sortable table listing the predicted TFBSs above the selected score threshold.
Table headers contained in the output
-
contig: The name of the analyzed contig of the genome.
-
gene_locus: The name and ID of the gene.
-
gene_product: The function of the protein produced by the gene.
-
gene_start: The position of the gene's first nucleotide.
-
gene_end: The position of the gene's last nucleotide.
-
gene_width: The width (in nucleotides) of the gene.
-
tfbs_seq: The transcription factor binding site (TFBS) nucleotide sequence.
-
tfbs_start: The position of the binding site's first nucleotide.
-
tfbs_end: The position of the binding site's last nucleotide.
-
tfbs_strand: The DNA strand on which the binding site was found.
-
tfbs_dist: The position of the binding site relative to the translation start codon of the gene.
-
tfbs_region: The type of region where the binding site is located (upstream region, regulatory region, coding region, or terminator region).
-
tfbs_score: The score of the interaction between a transcription factor and its predicted TFBS based on the sequences used to generate the position weight matrix (PWM).
-
max_matrix: The maximum PWM score is the consensus sequence of the used PWM.
When selecting ‘Show co-transcribed genes’, two supplementary fields appear:
-
cotr_locus: The names and IDs of the co-transcribed genes.
-
cotr_product: The functions of the proteins produced by the co-transcribed gene.
Functional analysis
Overview
The second output tab presents the functional analysis (metabolic pathway and biological process) of the genes predicted to be regulated by the selected TF. This page is structured into three sections: a Customization Panel (A), an Interactive Barplot (B), and an Interactive Result Table (C).
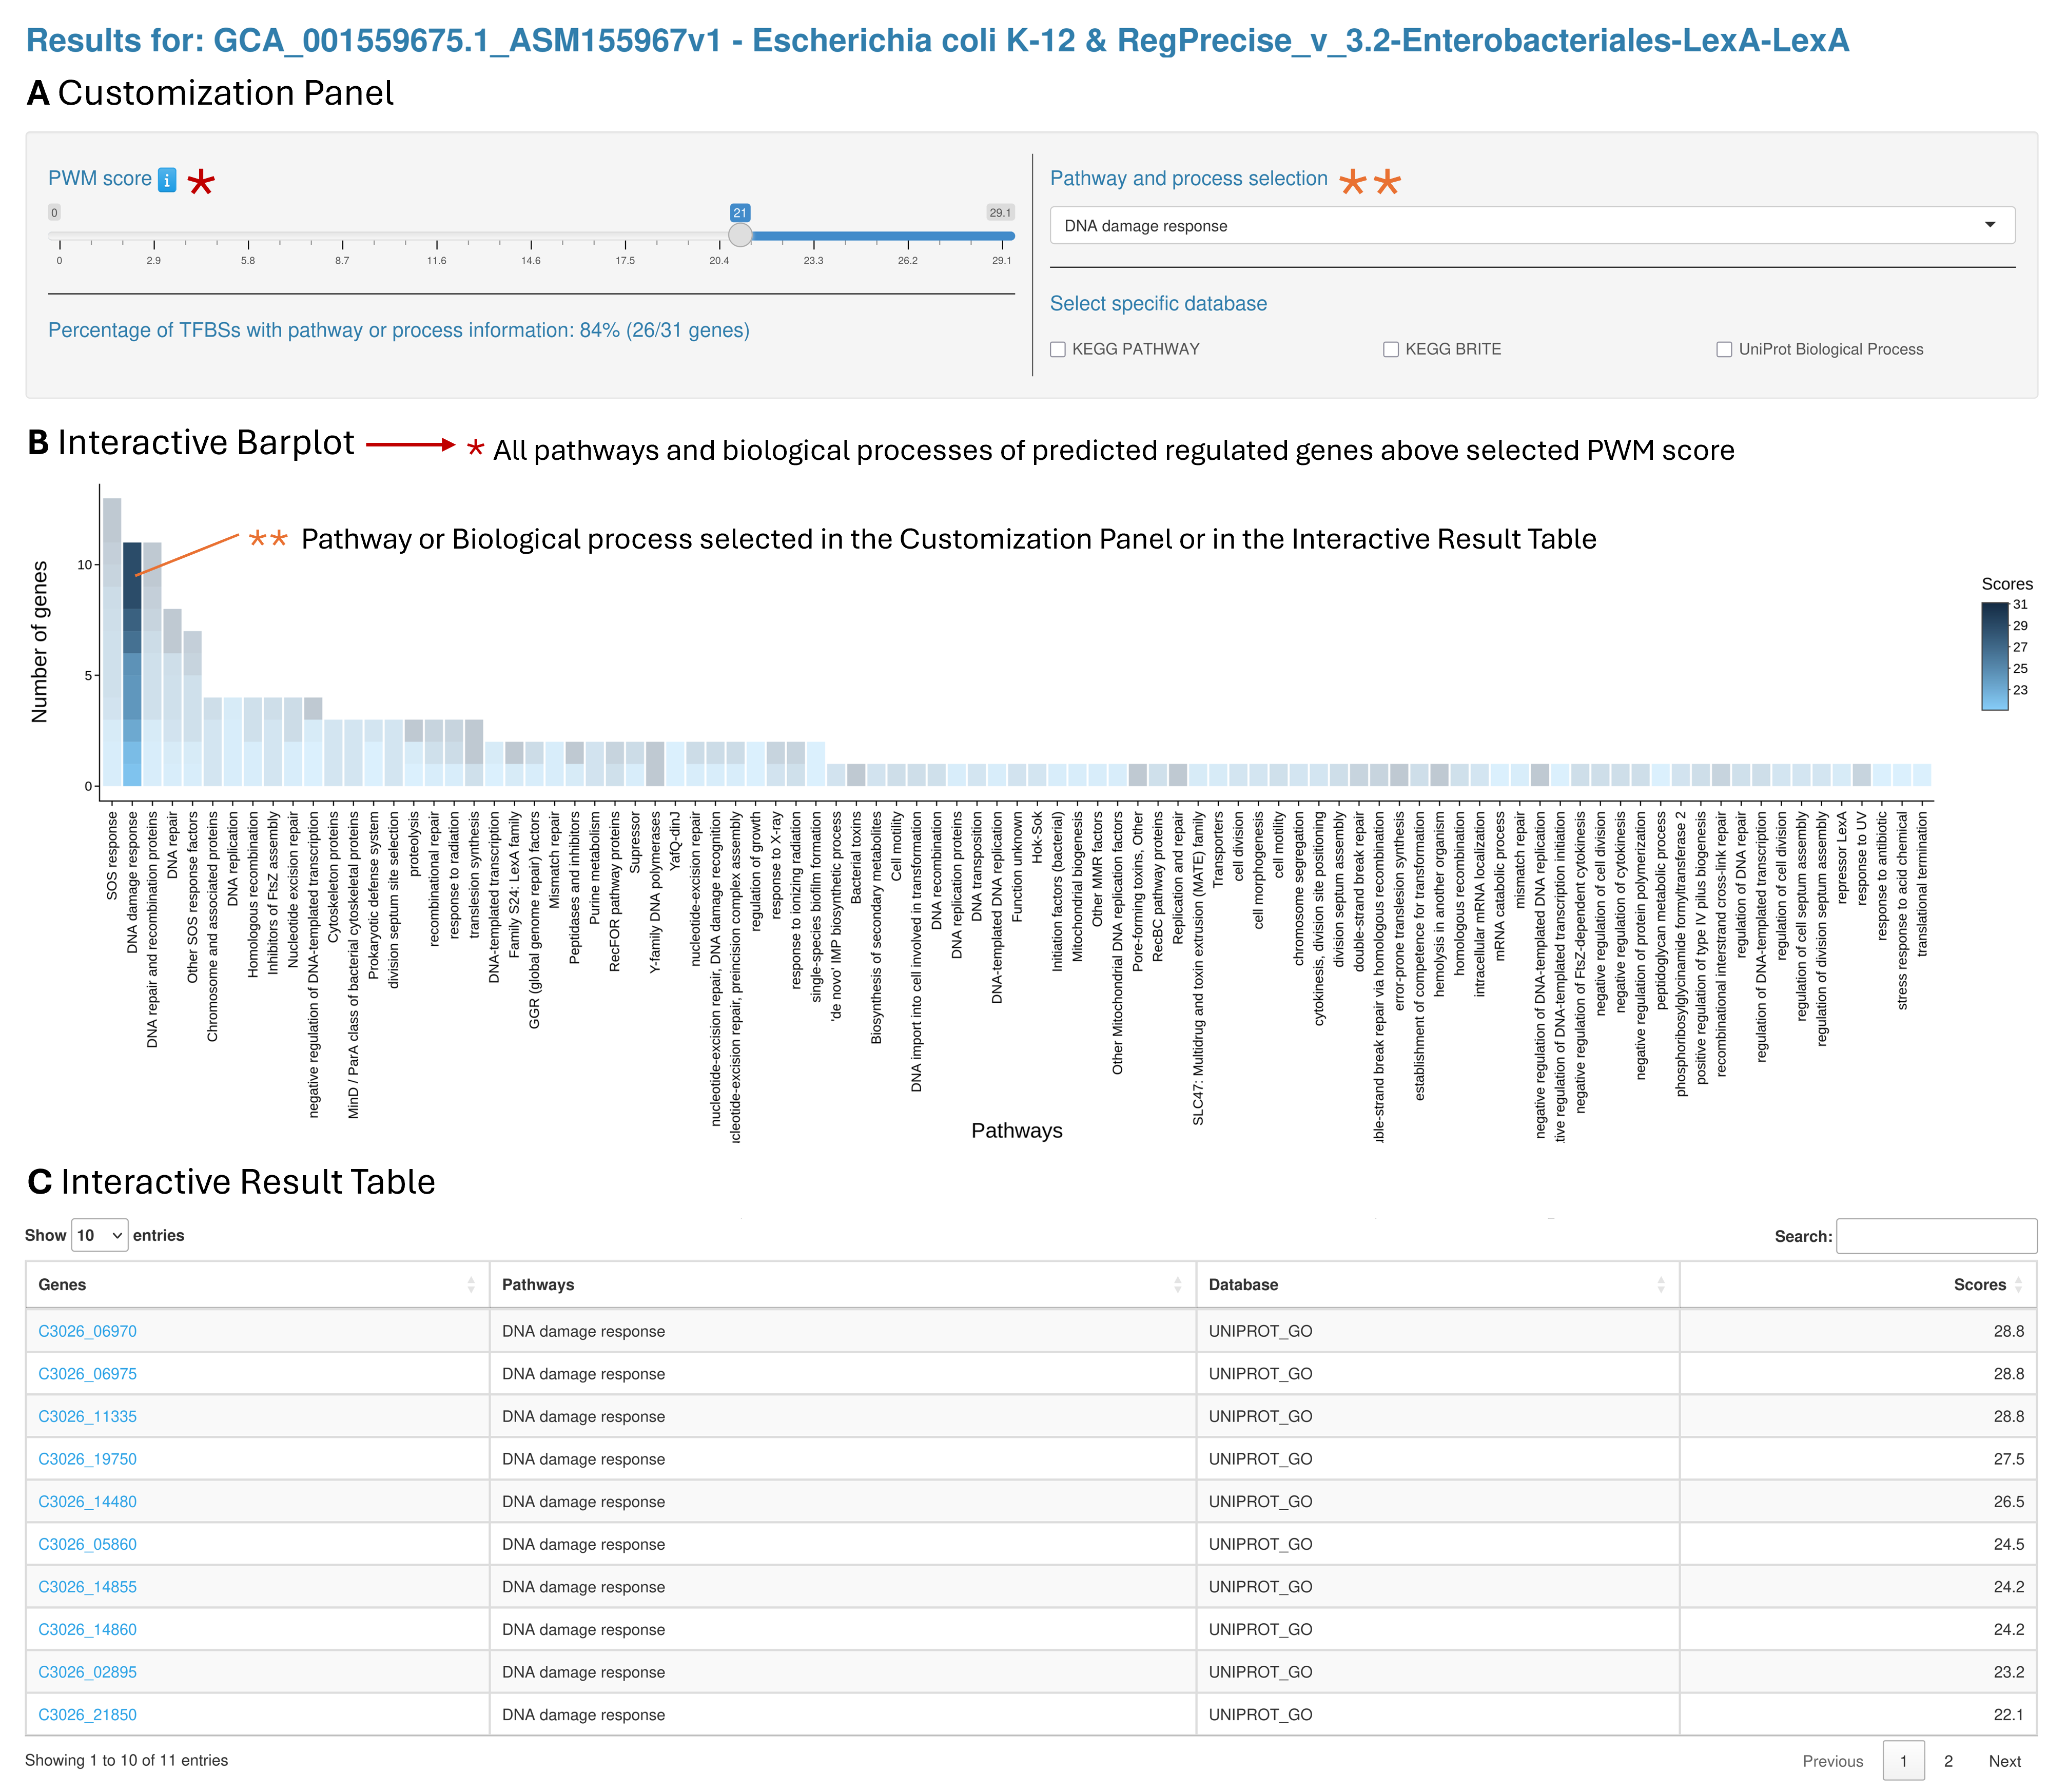
Overview of the pathway and biological process analysis page. Customization Panel. It contains a slider to adjust the PWM score threshold and other filters to adjust the result output. All changes are applied in real time and immediately update the Interactive Barplot and Results Table. The percentage of TFBSs with pathway or biological process information is also displayed and updated according to the selected PWM score threshold. B. Interactive Barplot. A visual representation showing the number of genes that were found in each pathway or biological process. C. Interactive Result Table. The table lists all the pathways and biological processes linked to the predicted genes above the selected score threshold. Users can sort the table by any column and type in key words to look for specific results. There are also hyperlinks in the table connecting genes to their KEGG gene page.
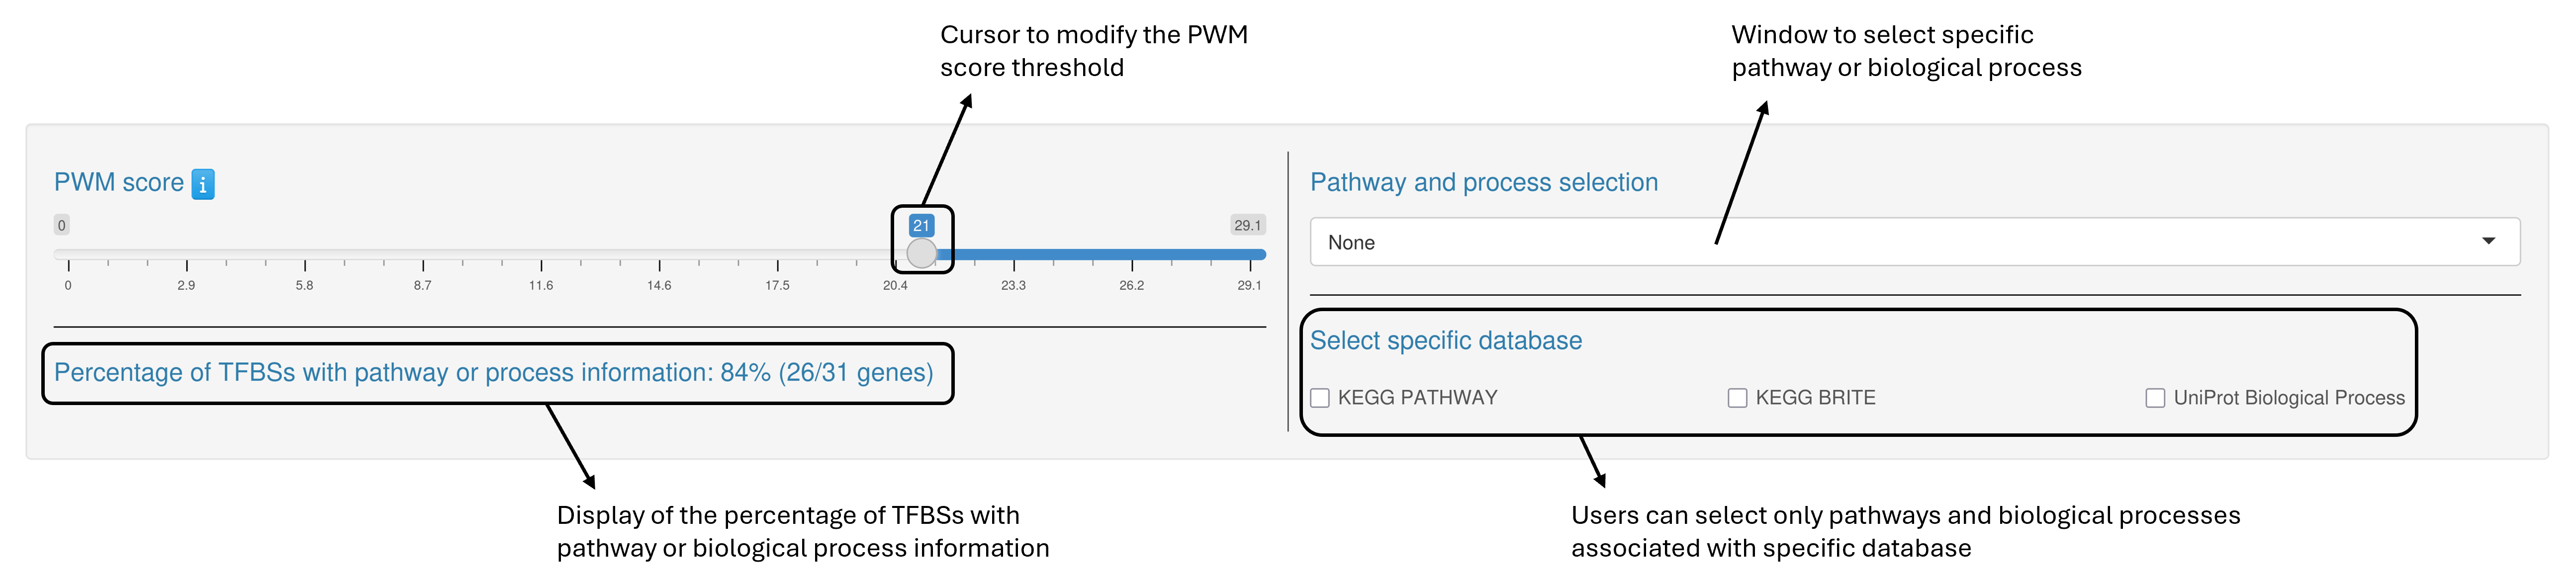
Customization panel
PREDetector enables users to adjust a set of parameters and options that directly affect both the barplot and the results table.
Interactive Barplot
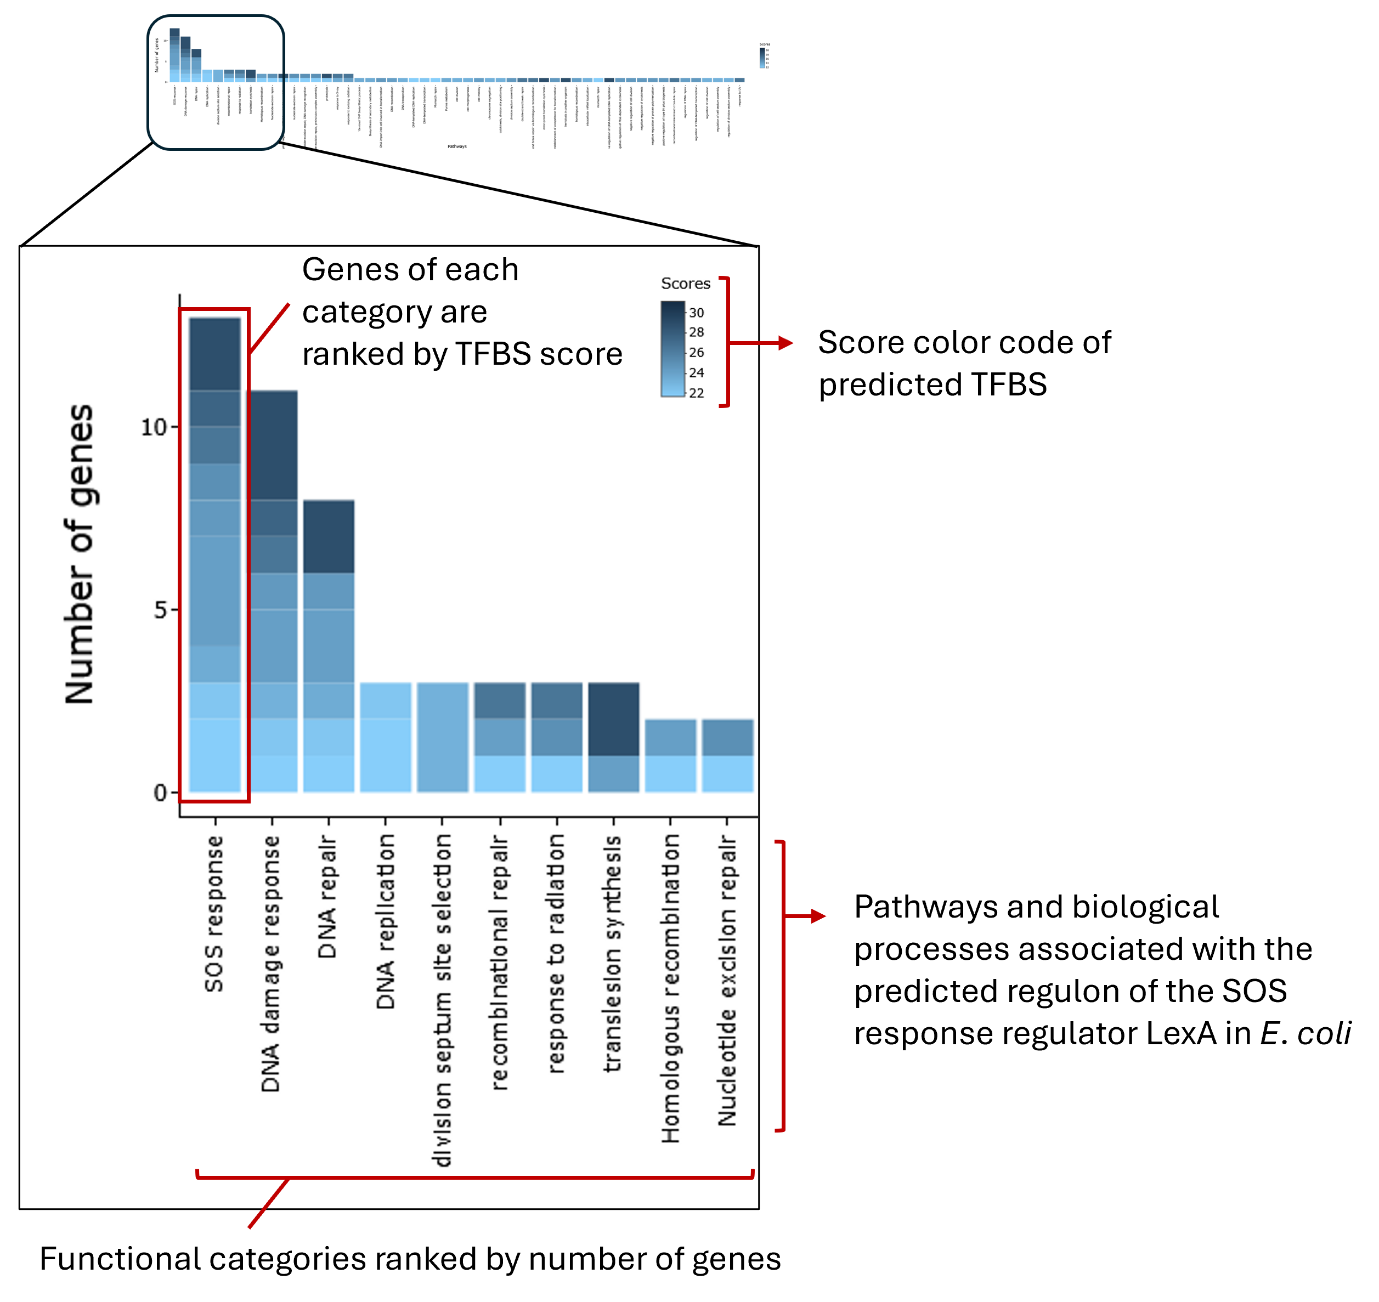
Zoomed-in view of the interactive barplot for the predicted LexA regulon in E. coli as an illustrative example. View of the global barplot, focusing on the most abundant pathways and biological processes linked to the predicted LexA regulon of E. coli at a specific PWM score threshold. Functional categories are ordered by the number of associated genes. The height of each bar reflects the number of genes assigned to a given category, and stacked segments within each bar represent individual genes colored according to their TFBS/PWM score.
Interactive result table
A searchable and sortable table listing the predicted metabolic pathways and biological processes above the selected score threshold.
Table headers contained in the output
-
genes: The name and ID of the gene.
-
pathways: Pathways or biological processes associated with the predicted regulated gene.
-
database: Database from which the information was taken.
-
score: The score of the interaction between a transcription factor and its predicted TFBS based on the sequences used to generate the position weight matrix (PWM).